“Nothing but Debt:” March Madness, Maryland Schools Edition
This year ProPublica released a different sort of NCAA tournament bracket, one based on how well schools serve low-income students. Princeton came out on top, based on federal data covering five categories: percentage of students receiving Pell grants, average annual cost to low-income students, median federal debt at graduation, the rate of Pell students not repaying their loans 3 years after graduation, and the discount off total cost. We gave the same treatment to 27 colleges and universities in Maryland with a few key differences:
- We include four-year public, private not-for-profit, and private for-profit schools regardless of their basketball teams’ prowess
- We do not consider the discount off total cost, instead we look at the first four categories and use the rate of non-repayment as a tie breaker[i]
- We seeded teams according to endowment size rather than NCAA ranking, reasoning those with more money would be better situated to help low-income students[ii]. That does not mean that schools use their endowment to help low-income students; just that they have the capacity to.
See the results below.
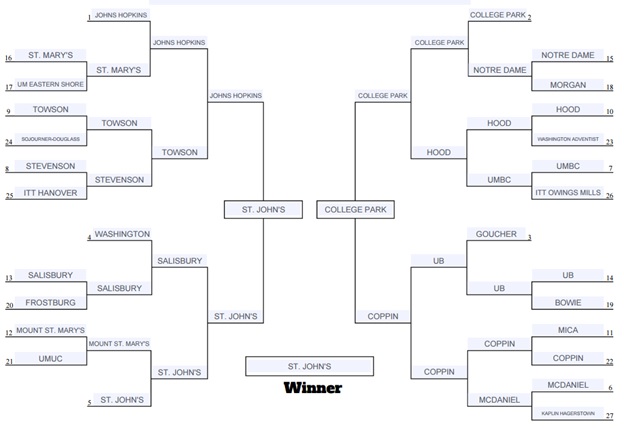
Data source: ProPublica
St. John’s College came in first, notably defeating Johns Hopkins University, which has by far the largest endowment of any school in the state. On average, the private not-for-profit schools tend to have lower rates of Pell grantees, higher annual cost, higher average debt and lower rates of non-repayment than public colleges.
Maryland’s public schools give a strong showing, with five making the elite eight. University of Maryland College Park makes it all the way to finals, coming in a close second. The state’s historically black colleges and universities (Morgan State University, Coppin State University, Bowie State University and the University of Maryland Eastern Shore) enroll Pell grantees at a significantly higher rate than average, and graduates have higher rates of loan non-repayment. In recent years, student loans have become increasingly burdensome for Americans, with 35 percent of adults carrying student loan debt, 56 percent of whom are worried they may not be able to repay their loans.[iii] A coalition of alumni from Maryland’s HBCUs filed a lawsuit asserting that the state’s unequal funding and unnecessary duplication of programs at traditionally white institutions puts graduates of HBCUs at a disadvantage because schools whose alumni they compete with are better funded with newer facilities.[iv] While the case is still wrapped up in court, a federal judge has ruled that the state must address the “shameful history of de jure segregation.”
Mounting evidence illuminates the failures of private for-profit colleges,[v] and the data in Maryland reflects these failures. On average, students at the three for-profit colleges we included—most of whom receive Pell grants—paid more annually, ended up with more debt, and failed to repay loans at a rate more than 30 percentage points greater than their peers at not for-profit schools. With more than 80% of graduates unable to repay student loans, for-profit schools in Maryland function more as money-making debt traps than educational institutions.
The upshot? Colleges and universities in Maryland across the board have room to improve how they serve low-income students.
| School | Students Receiving Pell Grants | Avg. Cost for Low-Income Students | Median Federal Debt of Pell Grantees | Nonrepayment Rate of Pell Grantees | 2015 Endowment |
| Public | |||||
| Morgan State University | 57% | $13,138 | $23,750 | 81.70% | $23.67 million |
| University of Maryland Eastern Shore | 54% | $11,345 | $17,500 | 79.60% | $24.62 million |
| University of Maryland Baltimore County | 27% | $11,501 | $19,446 | 37.90% | $80.71 million |
| University of Maryland College Park | 20% | $6,938 | $17,750 | 28.20% | $280.3 million |
| St. Mary’s College of Maryland | 19% | $4,827 | $19,500 | 25.10% | $32.7 million |
| Bowie State University | 50% | $8,514 | $17,750 | 75.70% | $22.99 million |
| Coppin State University | 61% | $9,340 | $13,118 | 78.60% | No data available |
| Frostburg State University | 37% | $14,521 | $17,500 | 48.30% | $22.99 million |
| Salisbury University | 21% | $8,468 | $17,800 | 42.40% | $45.71 million |
| Towson University | 26% | $9,034 | $16,587 | 41.20% | $71 million |
| University of Baltimore | 43% | $12,601 | $16,500 | 61.80% | $45 million |
| University of Maryland University College | 57% | $15,944 | $26,500 | 61.00% | $19.2 million |
| Average | 39% | $10,514 | $18,642 | 55.13% | |
| Private Not-for-Profit | |||||
| Hood College | 35% | $16,463 | $26,018 | 36.60% | $70 million |
| Mount St. Mary’s University | 23% | $21,930 | $22,500 | 34.40% | $47.6 million |
| Notre Dame of Maryland University | 28% | $9,355 | $26,062 | 54.90% | $33.8 million |
| Stevenson University | 32% | $18,391 | $21,590 | 48.90% | $77.42 million |
| Washington Adventist University | 57% | $15,944 | $26,500 | 61% | No data available |
| Johns Hopkins University | 13% | $10,049 | $14,517 | 24.60% | $3.381 billion |
| Goucher College | 25% | $18,815 | $21,500 | 36.40% | $216.7 million |
| McDaniel College | 32% | $11,740 | $23,700 | 22.40% | $115.5 million |
| Sojourner-Douglass College | 68% | $20,346 | $1,900 | 86.30% | No data available |
| St. John’s College | 25% | $18,216 | $22,535 | 22.60% | $157.3 million |
| Washington College | 14% | $17,088 | $26,950 | 29% | $201.8 million |
| Maryland Institute College of Art | 25% | $30,743 | $27,000 | 35.90% | $51 million |
| Average | 31% | $17,423 | $21,731 | 41.08% | |
| Private for-Profit | |||||
| ITT Technical Institute Hanover | 65% | $23,842 | $13,947 | 80.60% | |
| ITT Technical Institute Owings Mills | 70% | $23,174 | $13,947 | 80.60% | |
| Kaplin University Hagerstown Campus | 74% | $23,508 | $10,532 | 82% | |
| Average | 70% | $23,508 | $12,809 | 81.07% | |
| Source: https://projects.propublica.org/colleges/states/MD | |||||
[i] For example: in the first round St. Mary’s went up against University of Maryland Eastern Shore, resulting in a score of 2-2, St. Mary’s with a lower annual cost and a lower non-repayment rate and University of Maryland Eastern Shore with a higher percent of students receiving Pell grants and a lower average federal debt at graduation. In this case St. Mary’s advances to the next round because of the lower non-repayment rate. A growing body of research shows earning a degree does not guarantee economic mobility (https://www.brookings.edu/blog/social-mobility-memos/2016/02/19/a-college-degree-is-worth-less-if-you-are-raised-poor/, https://www.bostonglobe.com/magazine/2016/05/18/hopes-dreams-debt/fR60cKakwUlGok0jTlONTN/story.html, http://www.nbcnews.com/feature/in-plain-sight/wealth-moves-out-grasp-blacks-so-does-opportunity-n305196) and ability to make progress repaying loans is a stronger indicator of economic success than tuition discount rate.
[ii] Schools without endowments including for-profit schools were seeded last.
[iii] http://www.urban.org/sites/default/files/publication/23736/412849-Forever-in-Your-Debt-Who-Has-Student-Loan-Debt-and-Who-s-Worried-.PDF.
[iv] https://www.washingtonpost.com/news/grade-point/wp/2017/01/04/disparity-in-marylands-public-higher-education-goes-on-trial/?utm_term=.1d1637c9178d.
[v] http://journals.sagepub.com/doi/abs/10.1177/0038040716666607, http://fortune.com/2016/05/31/for-profit-colleges-salaries/.